
It might be the most-feared — and most underrated — challenge in mobile: the leaky bucket. That is, acquiring new users who uninstall your app so that you have to accelerate your UA efforts to make up for it — like trying to fill a leaky bucket with water.
That being said, the data is clear: user churn is one of the most critically important challenges to tackle in your mobile growth strategy. Why? Because the average app sees 95.5% of its users churn within the first 90 days of install. To effectively confront this, an app just needs to reduce its churn by 5%, which can boost its profitability by 75%.
Below, we cover the do’s and don’ts of user churn analysis; so that you can optimize your conversion funnel for maximum ROI.
Do’s for a User Churn Analysis
Undertake Cohort Analysis
Before you go about tackling a your user churn analysis, it’s critical to gain a better understanding of your users — both those that stay engaged with your app and those that don’t. Cohort analysis is a useful method for understanding why users leave and what actions drive retention.
To use cohort analysis, break down your user base into cohorts organized around engagement. For example, if you have a game app, you might identify a cohort of users who spend the most on in-game purchases. If you’re a delivery app, you might identify cohorts based on purchase frequency. For example, you could create a cohort of users who order a delivery at least once a week and another cohort of users who make an order at least once a month.
From here, you can analyze further details about these users such as the following:
- How they were acquired: Where did your most engaged users come from — search, social, paid ads, referral, etc.?
- What they do: What actions do your most engaged users take? Are they most likely to make a certain in-game purchase, or order during a certain time or day, etc?
- How long it takes them to do it: How long does it take your most engaged users to complete said actions? Do they leave their shopping cart inactive and come back to it or do they complete a purchase right away.
Compare your analysis of user behavior between engaged and churned cohorts. From there, invest in initiatives and promotions that respond to these user behaviors to decrease your overall churn rate.
For example, if churned users often come from paid social ads, then decrease your investment in that acquisition channel. If long-term engaged users are most likely to make in-game purchases at night, send push notifications at this time. If users tend to convert right after install, make sure your onboarding and checkout process is as streamlined as possible.
Check What Users Do Right Before They Churn
This is a fairly straightforward ‘Do’ that builds off the previous point when conducting a user churn analysis. Through your cohort analysis, identify the group users in your audience base that show the highest churn rates. From there, drill down on their actions and behaviors leading up to when they churn.
For example, if you’re a game app and users often churn at level 3, then check to see if the content on that level of your game is too difficult or easy. If you’re an e-commerce app and users often uninstall after a month of inactivity, then send a promotion or discount to your users around the 3-week mark.
Figure Out Your App’s ‘AHA’ Moment
Again, this ‘Do’ is easy to undertake if you’re doing cohort analysis. The AHA moment is the point at which a user understands your app’s intrinsic value. You can identify this moment if you understand the patterns and behaviors of your power users.
Some example AHA moments:
- A Facebook user that makes 7+ friends in the first 10 days becomes a long-term user.
- On Twitter, once a user follows 30 accounts, they stay engaged.
- Once a Dropbox user uploads their first file, they’re sticky.
So, do some analysis of when a user goes from new user to long-term user. This might be reaching a certain level of your game or making a certain number of purchases in a specific time period. From there, invest in marketing activities that bump users up to these key AHA moments in your funnel.
Don’ts for a User Churn Analysis
Don’t Forget to Account for Seasonality
Some amount of user churn is normal, especially at certain times of the year depending on your app category. For example, if you’re a shopping app, you might see more churn in the months following big shopping seasons, such as after the new year. If you’re a game app, you might see more user churn during busier times of the year, when your player base is less likely to be on their phones, like in the fall when school starts.
A critical step in any robust user churn analysis is identifying a baseline alongside which to measure your churn rate. This will help you understand where your app falls on the scale of normal or abnormal drop-off.
The chart below from Clevertap gives a useful understanding of normal churn rates per app category over the course of a month.
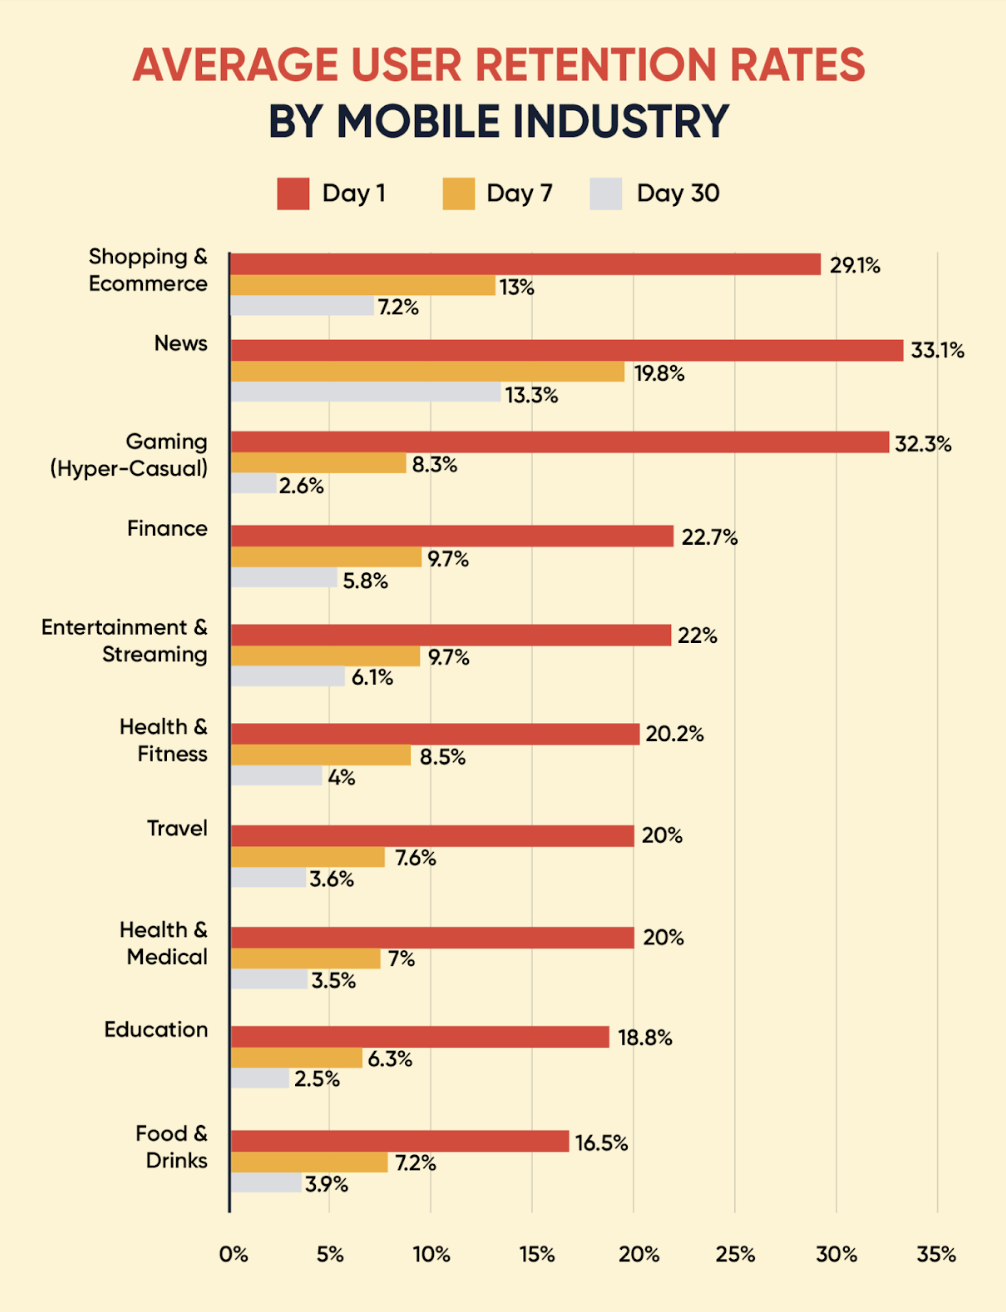
Data source: Statista, 2020
Don’t be Push-y With Your Users
Communication strategies like push notifications and in-app modals are a great way to serve personalized messaging to your users, but don’t overdo them.
Oftentimes, you’ll see shopping apps sending too many push notifications to users. You explore or buy a few items, and suddenly your app and notifications are peppered with related products. Be the refreshing app that understands its users and takes a different approach. Rather than incessantly sending messages to users, send messages at key moments and personalize them based on your user churn cohort analysis to meet a user’s needs, timing and interests.
Also, don’t forget to use deep links to maximize your messaging; so that users that respond to your notifications are taken to the exact point of conversion in your funnel.
Overlook Your Onboarding Flow
Onboarding is the first touchpoint your users have with your app so make sure it’s a fantastic experience. If you’re onboarding requires account creation, make sure the process is as simple and streamlined as possible to limit user drop off.
If your onboarding includes a lot of information, find ways to space out that information. Rather than presenting all the necessary information during onboarding, identify key moments when you might be able to present portions of needed info later in your flow.
Finally, when you do your cohort analysis and identify your AHA moment, find ways to limit the gap between your onboarding and your AHA moment. If you’re a shopping app, this could be by making payment information savable so users are more likely to make a certain number of purchases. For a game app, this might be unlocking power-ups that accelerate users to a specific level.
Takeaways on Conducting a User Churn Analysis
User churn is one of the most critically important challenges to tackle in your mobile growth strategy. Why? Because the average app sees 95.5% of its users churn within the first 90 days of install. To effectively confront this, an app just needs to reduce its churn by 5%, which can boost its profitability by 75%.
The do’s and don’ts of user churn analysis:
- DO cohort analysis to understand your users better.
- DO check what users are doing right before they churn.
- DO identify your app’s AHA moment to invest in activities that optimize towards this point in your funnel.
- DON’T forget to account for seasonality and normal amounts of user churn in your analysis.
- DON’T overload users with too many notifications.
- DON’T forget to optimize your onboarding flow.
Invest in Retargeting to limit user churn!
Our team can help you craft personalized retargeting campaigns that enhance retention and limit high user churn rates. Reach out to us to discuss your lifecycle marketing needs!