If 2020 has taught us anything: it’s the potential pitfalls of making predictions about the mobile industry. In an industry already fraught with uncertainty, 2020’s shocking turn of events made mobile projections even more inconsistent. How and why did 2020 mobile marketing predictions deviate so far from reality? The answer: the unexpected boom in e-commerce of which mobile commerce, or m-commerce, was central.
The Predictions
Beginning of 2020: It’s the End of the World As We Know It
As the economic effects of the pandemic took hold in early 2020, so did panicked assessments of its effect on mobile ad spending. In August 2020, eMarketer revised its initial 2020 forecasts: Instead of their pre-pandemic prediction that mobile ad spend increasing to $105.34 billion, they projected ad spend would only reach $91.52 billion in 2020.
They noted that early spring 2020 was brutal for advertisers and publishers, with CPMs and spending bottoming out in April. While ad dollars began to return in May, the rebound was minor at best.
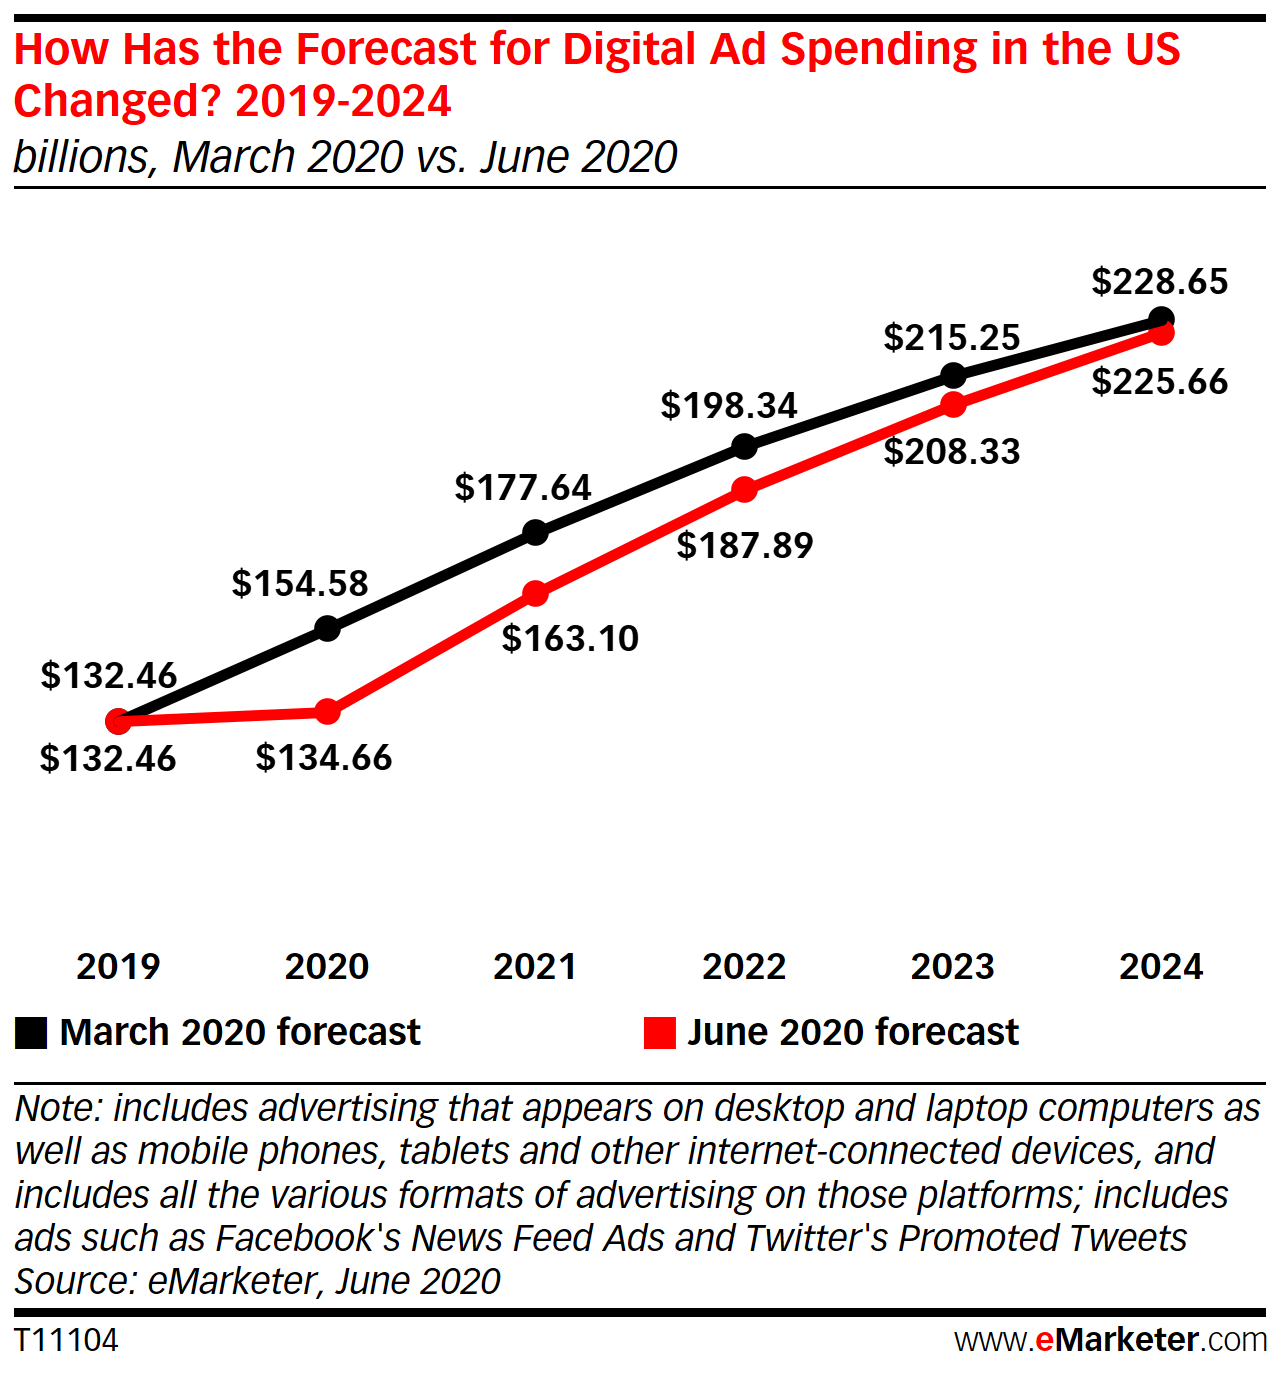
Source: eMarketer
End of 2020: Reassessment After the Mobile Surge
In December, eMarketer released an update on their forecast that took into account the unexpected surge in mobile usage during the pandemic.
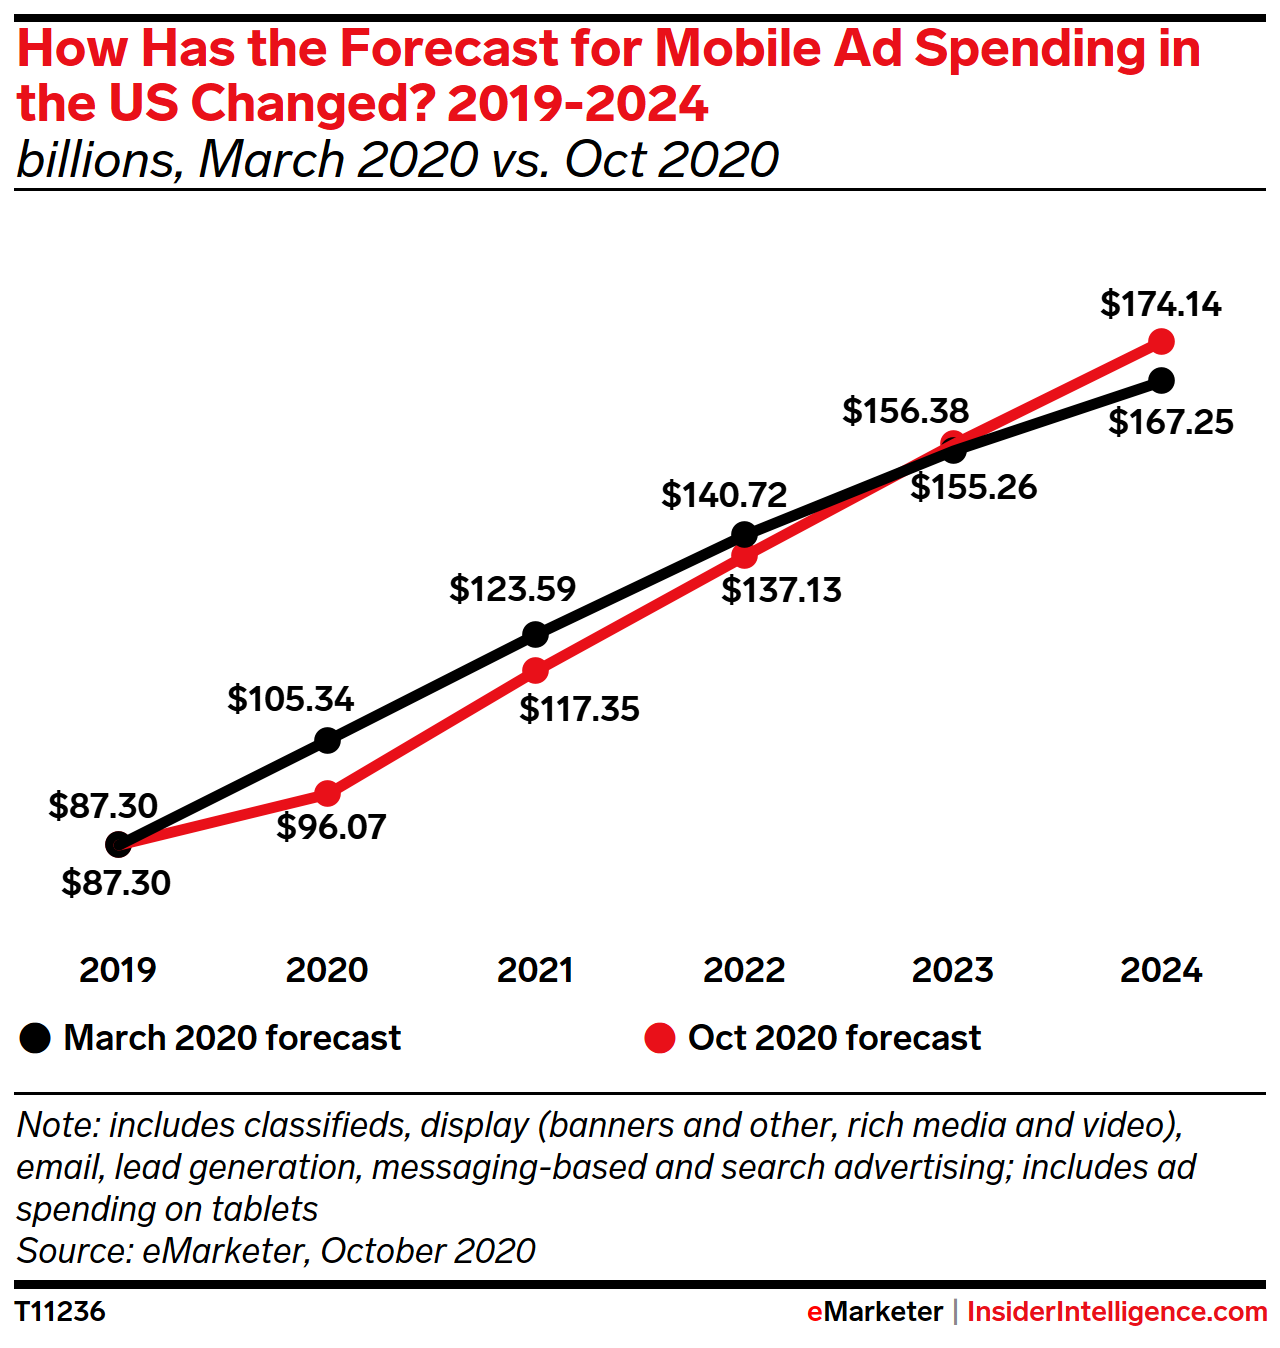
Source: eMarketer
Mobile ad spend still dipped below initial projections but not as low as previously expected ($96 billion instead of the initial $91 billion). They also revised their predictions to reflect a more accelerated rebound in mobile spend over the next 5 years. While the coronavirus pandemic had dampened growth in US mobile ad spending, due to increased mobile usage eMarketer noted that mobile ad spend would catch up to their pre-pandemic projections by 2023.
The Reality
As noted above, mobile ad spend dropped from the pre-pandemic prediction of $105.34 billion but not by as much as initially forecasted. Why was this the case?
Mobile Commerce is the New Shopping Spree
E-commerce boomed in 2020, achieving growth that analysts predicted would take at least half a decade. Mobile commerce, or m-commerce, was central to this growth.
According to Apptopia, U.S. shopping app sessions increased approximately 20% year-over-year in Q4 2020. This is a notable increase for a quarter that already sees high shopping activity every year, regardless of a pandemic. It also indicates an accelerated adoption of shopping apps compared to the previous year’s 12% YoY app session increase in the shopping app category from 2019 to 2020.
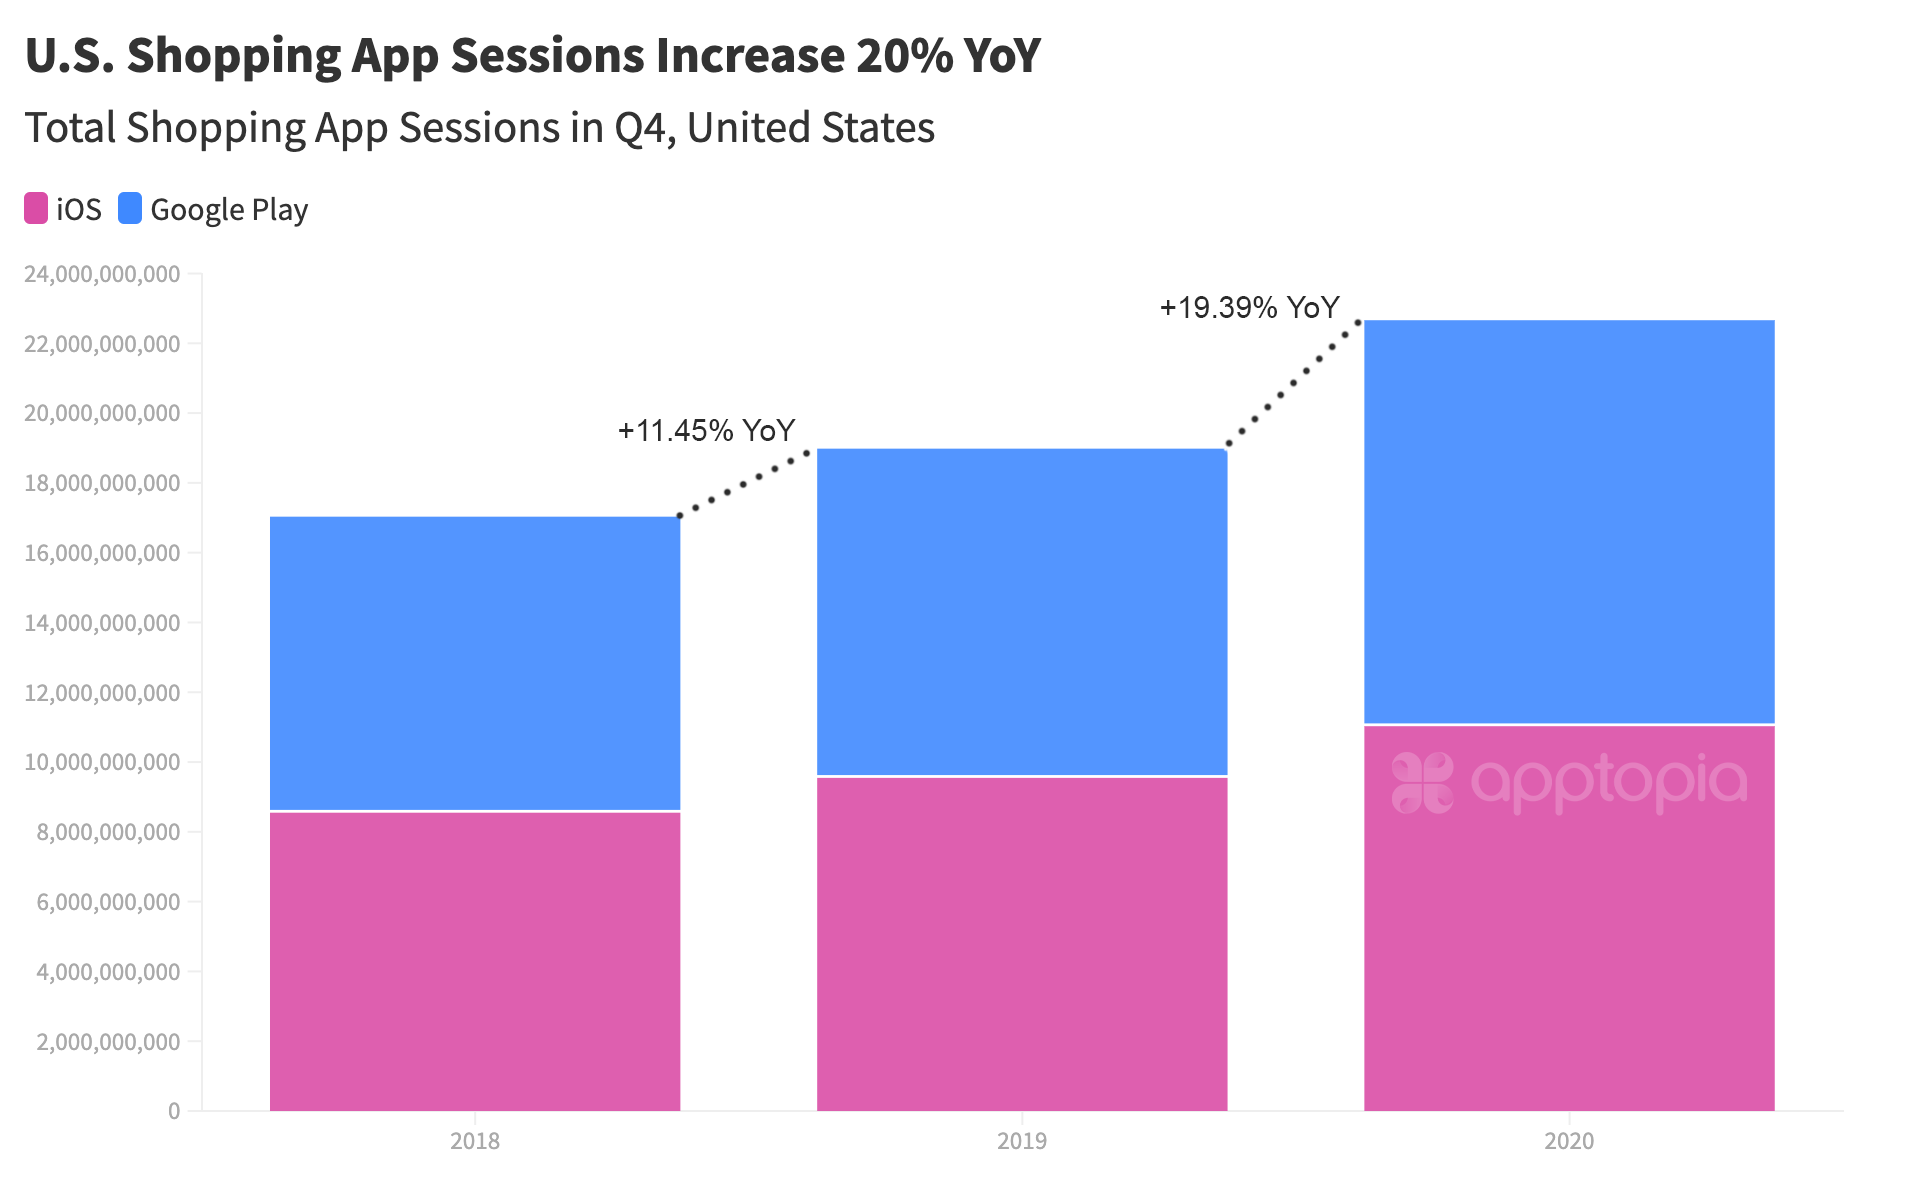
Source: Apptopia
Not only did users clock more time in shopping apps in 2020, more people downloaded a shopping app for the first time. First-time downloads of shopping apps had been decreasing in the U.S. since 2017. From 2017 to 2018, there was a 2.6% decrease in new downloads. From 2018 to 2019, this decrease accelerated to 4.7%. Last year marked a major reversal of this trend with a 7% increase in shopping app new user adoption in the U.S.
Amazon, Walmart and Wish were the top three most downloaded shopping apps in the U.S. Notably, of the retailers with the most downloaded shopping apps in the U.S., only 3 have physical locations — Walmart, Target and Nike.
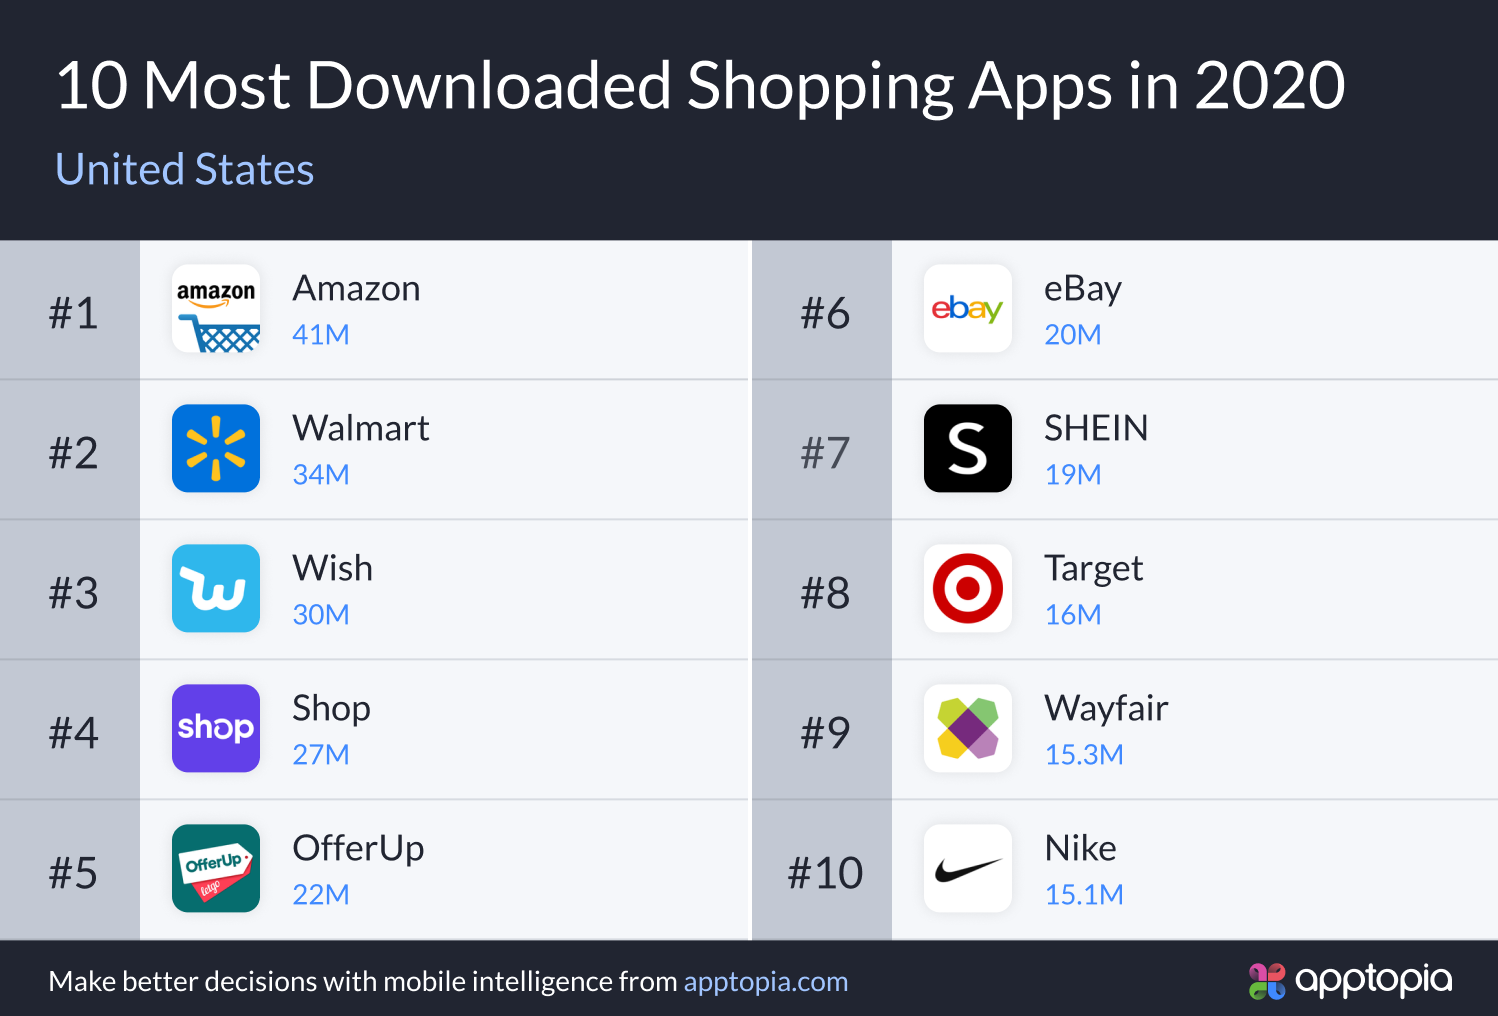
Source: Apptopia
The holidays in particular reflected an increased willingness of consumers to shop via apps. Shopping on smartphones jumped 25% to $3.6 billion on Black Friday. This made up a whopping 40% of total spend that day. On Cyber Monday, consumers spent nearly $10.8 billion online. This was over a 15% increase YoY with mobile accounting for 37% of total Cyber Monday sales.
The Rise of Buy Now, Pay Later Apps
Also in Q4 of last year, ‘Buy Now, Pay Later’ (BNPL) apps experienced their best quarter yet. Installs increased 135.7% year-over-year. This reflects a decline in economic and job stability, with a growing number of people turning to flexible payment apps for support. The growth of the BNPL app category also contributed to the commerce boom in Q4, allowing shoppers more buying flexibility despite economic instabilities. This further reflects the potential economic benefits fintech apps can provide during the pandemic.
The Klarna app currently dominates the BNPL app space with 45% market share.
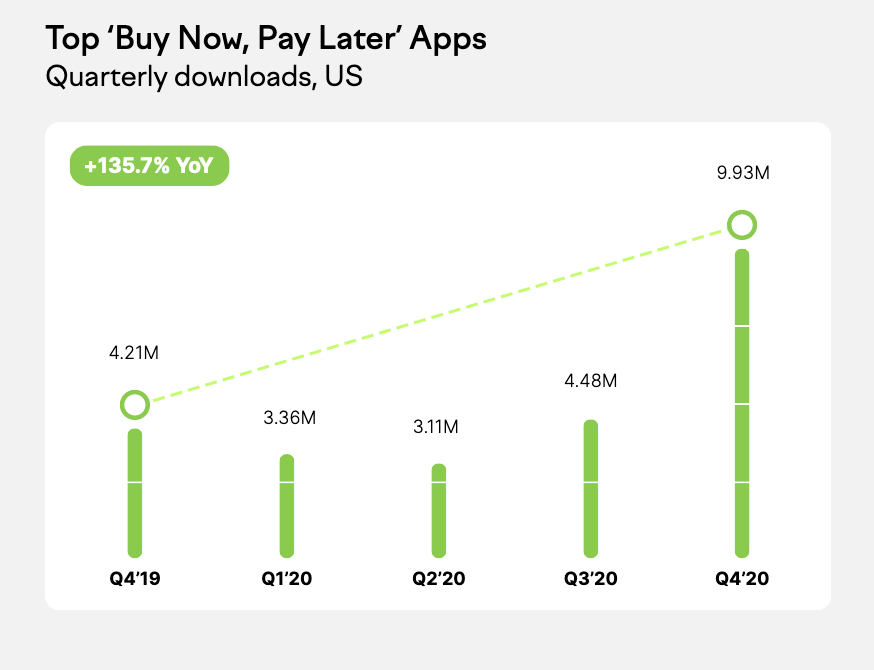
Source: Apptopia
Other Factors
We Are Entering a Mobile-First World
The coronavirus pandemic accelerated the transition to a mobile-first world by 2 to 3 years. In April 2020, the average user spent 4.3 hours per day on their mobile device. This led to a 70% increase in mobile ad placements in the first half of 2020.
More and more People Are Cutting the Cord on Pay TV
One of the major behavioural shifts in 2020 was an increase in video streaming. Around the world, more and more people bypassed traditional media sources, like pay TV, to stream series, shows and live events via the internet. In 2020, 80% of consumers streamed content via connected TV (CTV). With CTV outside of Apple and Google’s control and therefore open to targeted ad-tracking in the face of tightening data privacy regulations, advertising dollars are sure to continue flowing to this channel.
The Takeaway
E-commerce boomed in 2020, achieving growth that analysts predicted would take at least half a decade. Mobile commerce or m-commerce, was central to this growth. While the coronavirus pandemic dampened growth projections on mobile ad spending at first, the unexpected boom in mobile shopping led to accelerated predictions of an oncoming mobile-first world.
- U.S. shopping app sessions increased 20% YoY in Q4 2020, a massive increase for a quarter that already sees high shopping activity every year.
- 2020 also saw an increase of new user adoption of shopping apps (7%) reversing a decreasing trend of first-time shopping app downloads since 2017.
- Shopping on smartphones increased 25% to $3.6 billion on Black Friday, accounting for 40% of total spend that day.
- BNPL apps experienced their best quarter yet in Q4, allowing mobile shoppers more flexibility despite economic impacts.